

Distribution and Utilities Monitoring System H-NET
Overview
Aiming for optimal equipment operation
Capable of centralized management of daily data such as equipment
operating conditions and air and water consumption, in addition to
electricity monitoring.
Offers continuous automatic monitoring
of energy usage, which until now had to be checked visually.
It
visualizes data not only for individual equipment units but also for
entire factories and buildings to support various people, including
the management, equipment managers, and on-site personnel.

Cleaning and regular inspection of the air shower
Product Lineup
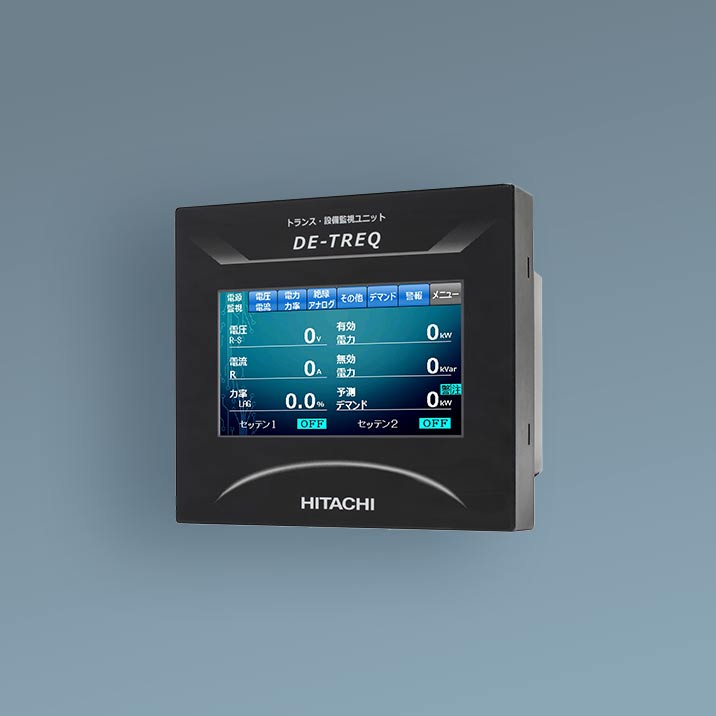
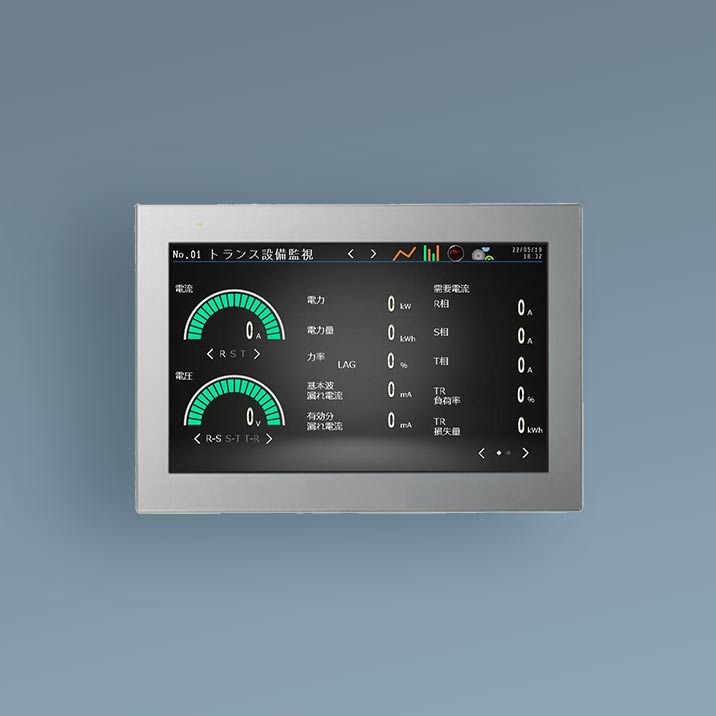
Transformer and equipment monitoring unit DE-TREQ
- Monitor demand, electricity, leakage current, and pulse/analog inputs with a single unit
- Equipped with a touch panel that can also monitor transformer load factor and loss amount
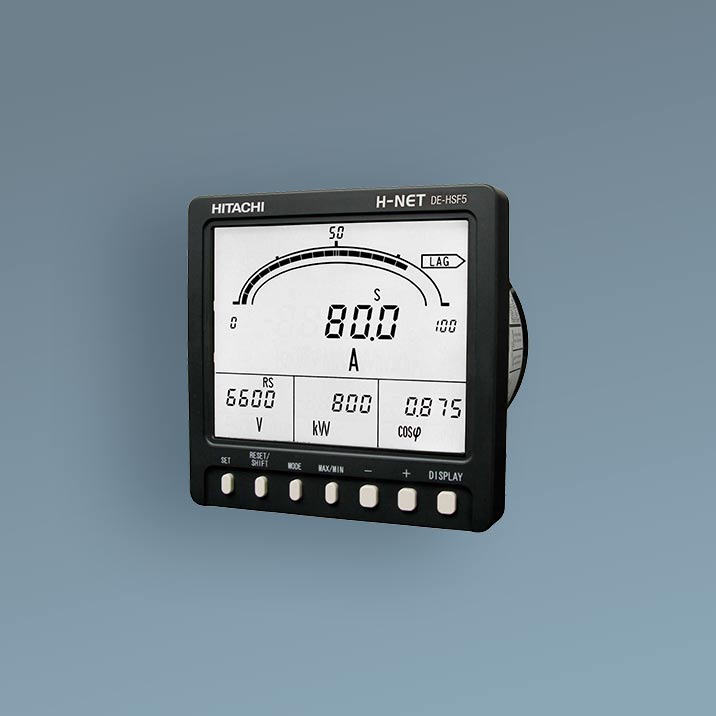
Meter type power monitoring unit(Japanese Only)
- Digital multimeter that can be used as an electricity meter for high-voltage feeders and transformers
- Compatible with 3-phase 3-wire, single-phase 3-wire, single-phase 2-wire, and 3-phase 4-wire* systems
- Dedicated product for 3-phase 4-wire systems.
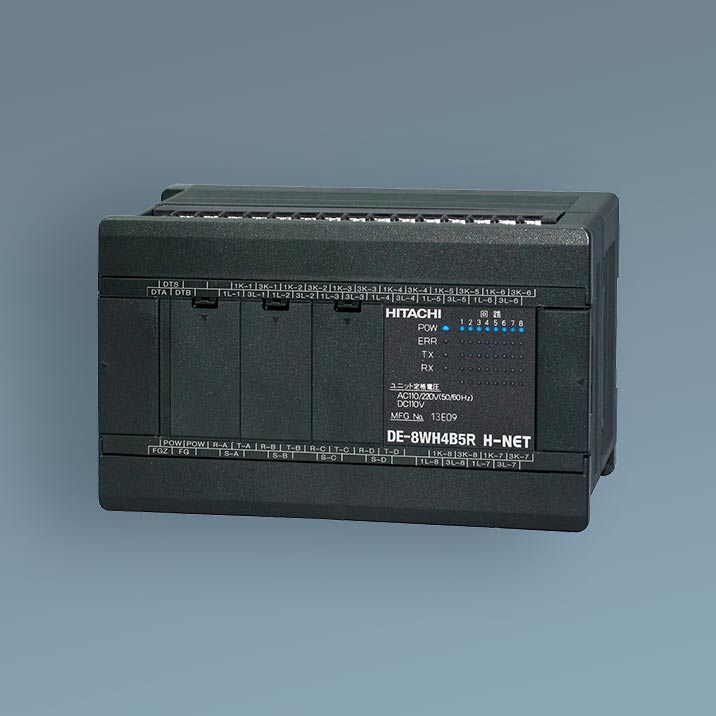
Panel-mounted power monitoring unit(Japanese Only)
- Panel-mounted unit that can be used as an electricity meter for high-voltage feeders and transformers
- Compatible with 3-phase 3-wire, single-phase 3-wire, and single-phase 2-wire systems
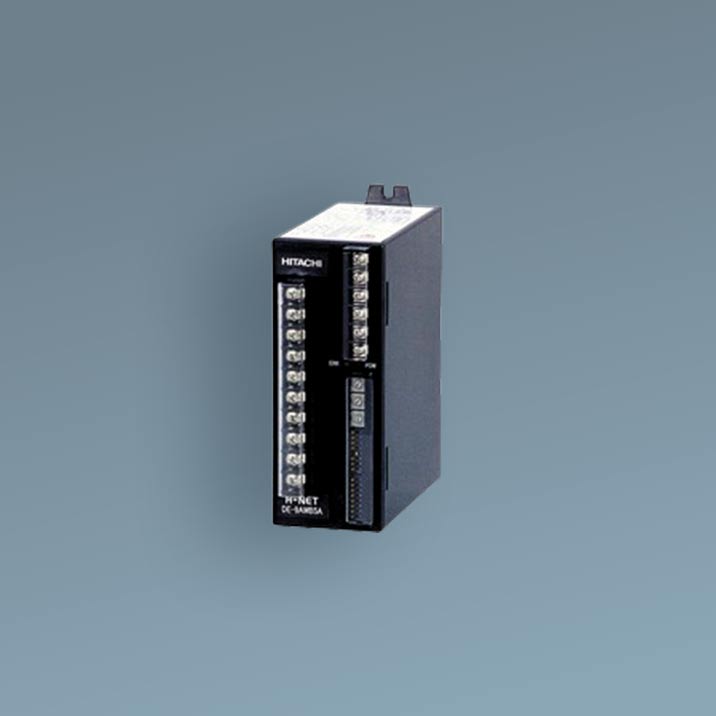
Electrical energy calculation unit(Japanese Only)
- Electrical energy calculation unit for other circuits
- Ideal for monitoring individual circuits for each MCCB (4-circuit and 8-circuit products)
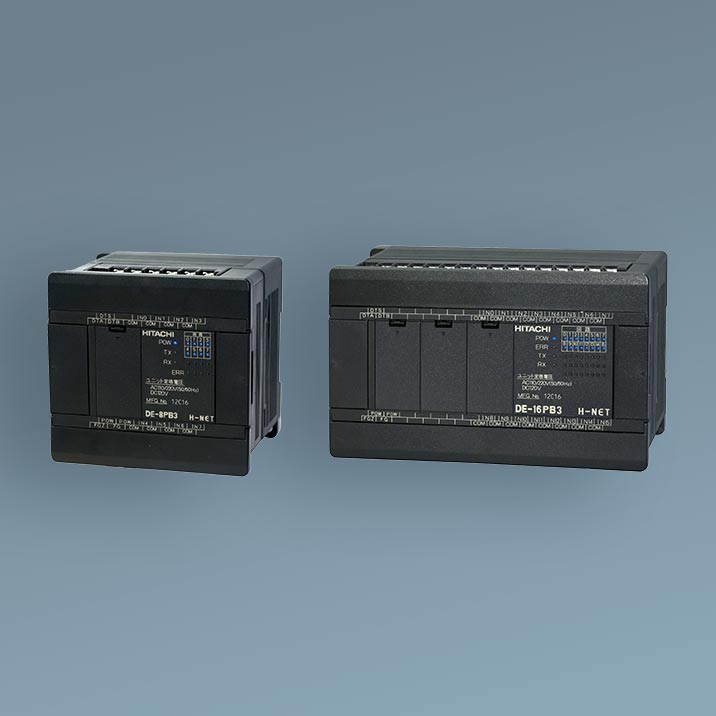
Pulse input unit(Japanese Only)
- Capable of pulse signal input and no-voltage contact input
- Ideal for monitoring demand at the connection point and checking the operational status of equipment
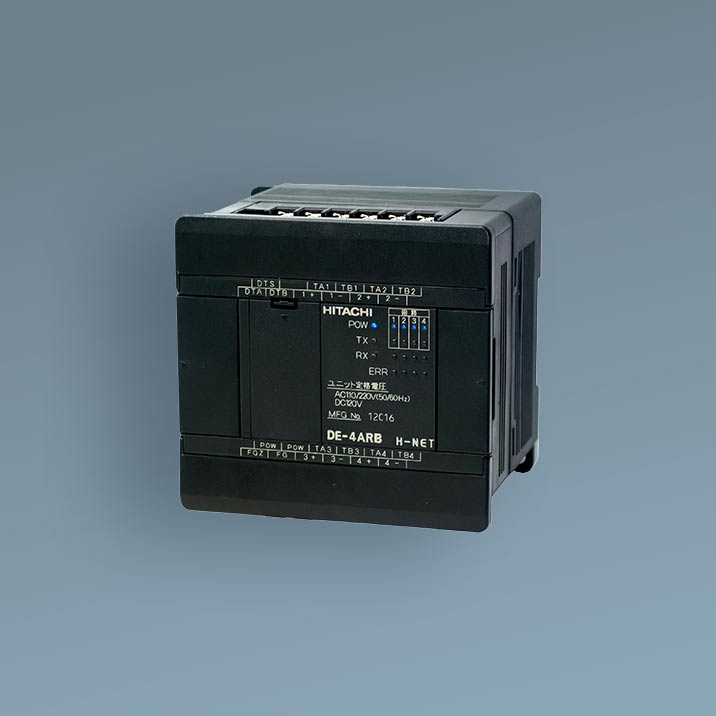
Analog input unit(Japanese Only)
- Acquires and manages various types of data such as flow rate and temperature with current (DC4-20 mA), voltage (DC1-5 V), and resistance input (Pt100)
- Upper and lower limits can be set for acquired data by connecting to the host software
Logger touch panel DE-HSLTP
- Easy system construction without the need for a PC


System configuration examples
Software
- Easy-to-configure packaged software
- Capable of monitoring from other PCs with the standard software alone
- Electricity, insulation, and utility data can be centrally managed on a single PC
Electricity monitoring
- Equipped with Modbus/RTU protocol for rich connectivity with other systems
- Model with a touch panel available.High visibility and easy operation for monitoring
Low-voltage insulation monitoring
- Preventive maintenance by monitoring leakage currents that can lead to fires and other accidents
- Uses the fundamental component method (Ior method), which features stable operation and space saving
Utilities monitoring
- Centralized management of utility equipment along with electricity and insulation monitoring
- Records and outputs warning for abnormalities with status monitoring and upper/lower limit monitoring


Four benefits of the introduction of H-NET
Demand monitoring for optimal electricity operation
Electricity charges = Basic charge + Electrical energy consumption charge
In order to reduce the basic charge, it is necessary to constantly
monitor demand and control the maximum demand power.
Forecasts are
made by demand monitoring and warning is output to notify when the
target demand is exceeded.
Electricity usage not reviewed and energy saving measures not taken

Electricity usage reviewed and energy saving measures taken

Contracted capacity can be reduced by reviewing electricity usage
Example: February is the month with the highest electrical energy consumption (demand), which determines the contracted capacity for the year from February to January of the following year
Constant monitoring of leakage current to identify signs of deterioration. Danger can be detected in advance!
Insulation resistance measurement once a year is insufficient to detect the signs and eliminate risks of sudden interruption of electricity
By introducing Hitachi’s insulation monitoring, leakage current can be constantly monitored. Monitoring the leakage current not only detects danger but also helps in the maintenance planning of equipment. In addition, connecting the unit to the system allows the measurement data to be saved, which can be used to readily compare the measured values with the past values and with other equipment.
Case 1: Heater leakage current data
A gradually increasing trend of the leakage current value was found. This allowed a heater replacement plan to be made in advance, which prevented equipment shutdown.

Case 2: Leakage current data at startup of submersible pump
Leakage current was found to increase as the submersible pump started up. After power off, it was found out that the measured insulation resistance of the pump was 0.01 MΩ. It provided the basis for a decision on replacement with a new one.

Capability of data measurement from the connection point to the individual MCCB
At a loss as to what to do about carbon neutrality initiatives
A wide range of data can be acquired, from high-voltage electricity such
as at the connection point to low-voltage electricity on the load side.
In addition, individual monitoring of each circuit breaker is
possible, which allows energy saving points to be found and operation
methods to be reviewed by subdividing the data to be visualized.
Transformers integrated and replaced with energy saving transformers
▼Analysis results
Transformers with unnecessarily large capacity found based on actual usage
▼Energy saving measures
Consolidation of transformers from 48 units to 33 units + replacement with more energy-efficient models
Power loss due to transformers reduced from 61.1 MWh/month to
19.2 MWh/month
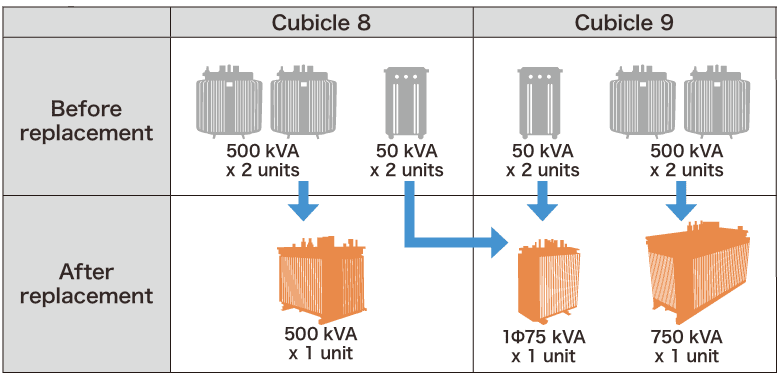
Replacement with high-efficiency amorphous transformers to achieve further energy saving effect
(From the results at our Nakajo Works)
Elimination of electricity usage in unnecessary hours
▼Analysis results
Manual warm-up before start of production, no stopping for lunch break
▼Energy saving measures
Use of timers to shorten warm-up time and reduce the number of running heaters during lunch breaks

- Calculated based on the condition of 20 operating days in a month, 30 yen/kWh
Energy saving points discovered by detailed hourly measurements
(From the results at our Nakajo Works)
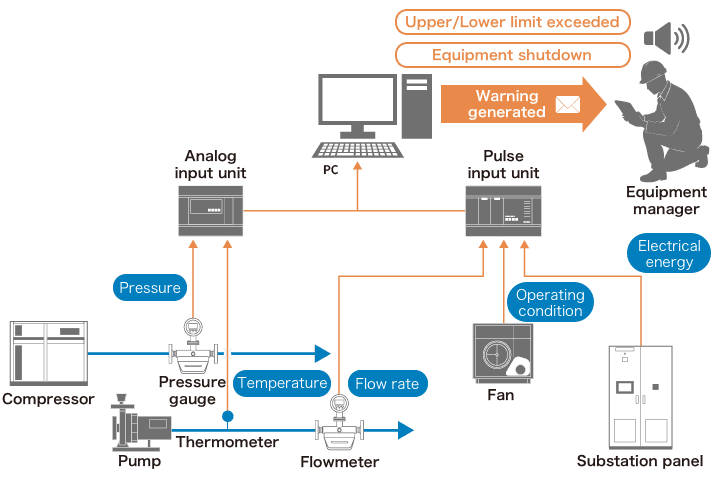
Acquisition of load equipment data for centralized equipment monitoring
For customers who want to centrally monitor data with a single system including data other than electricity
H-NET can acquire any integrated value data that can be acquired by
pulse (no-voltage contact)!
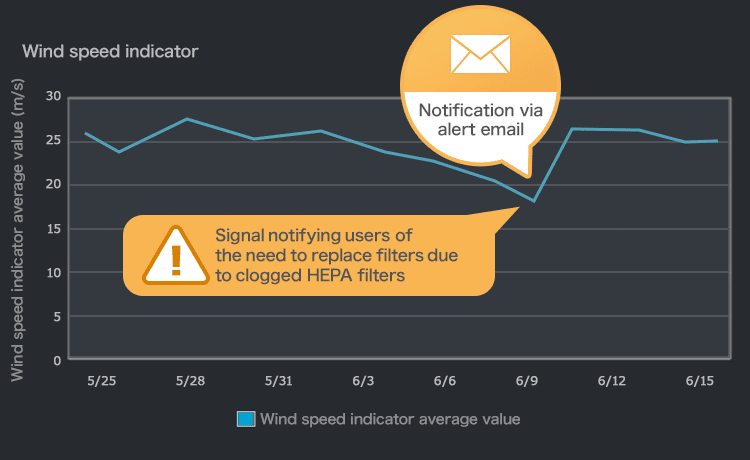
It can also acquire instantaneous
value data of DC 4-20 mA, DC 1-5 V, and resistance thermometer
(Pt100), making it effective for monitoring pressure, water volume,
and temperature.
Thresholds can be individually set for them to
output warning.
Example of energy saving
From peak cutting to peak shifting
H-NET provides total management, from demand monitoring at the connection point to trend management for each equipment unit.
Points for improvement
Demand monitoring of electricity usage
Trend management of electricity usage
Adjustment of equipment operating hours
Demand overrun predicted and prevented by shutting down air conditioning
Equipment start-up time shifted to reduce maximum electricity
Related Information
Inquiries
Click the links below to make inquiries about products, request a quotation, and download catalogs. Please feel free to consult with us.

